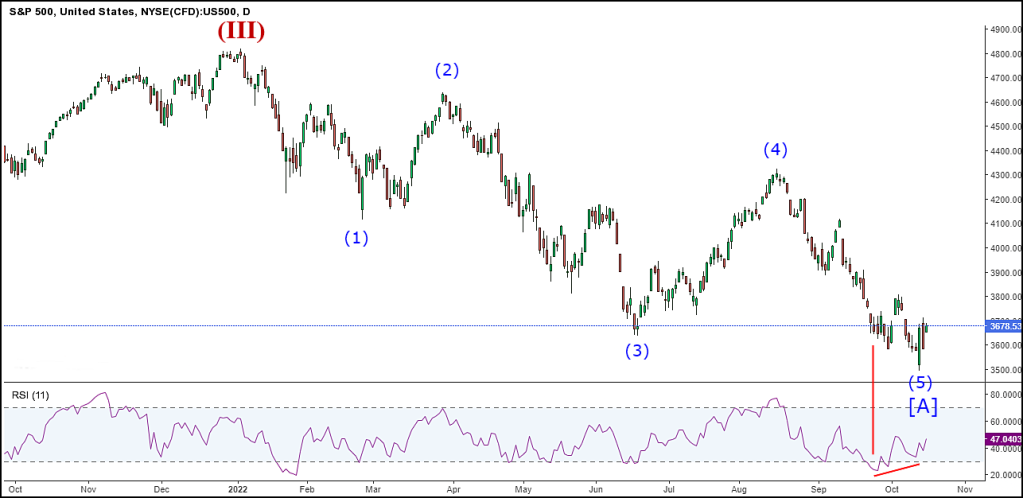
17th October 2022
The Primary [A] wave extended to 5 legs which portends a 5-3-5 evolvement. A typical retrace targets 4310 whilst a more urgent case will be halted at the 4000 mark. Its all a matter of hype and/or hooha.
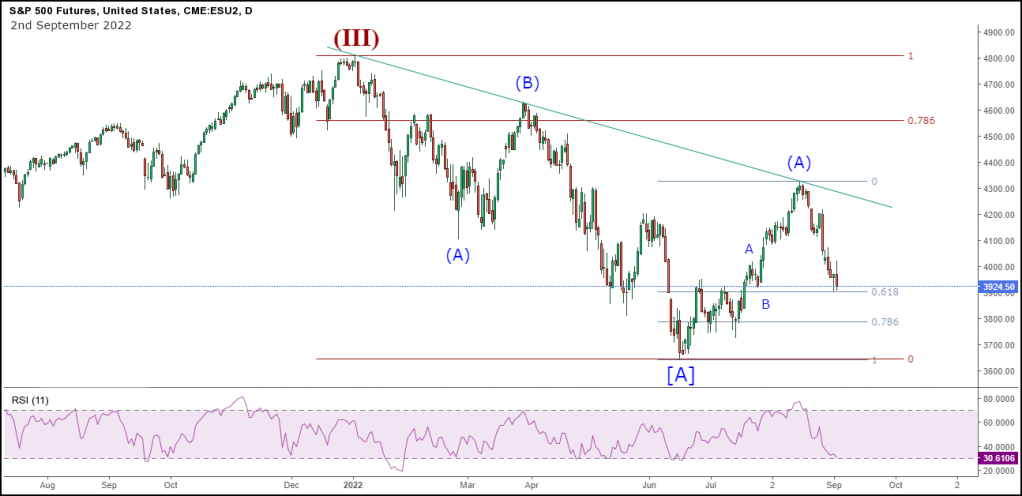
2nd September 2022
The turning point occurred as expected. Now there is a possibility and a probability. The probability is that the previous chart is correct when it sees a completed bear trend correction and a resumption of the trend. The possibility is that the correction will resume with a target of equal legs (C) = (A). The prospect of a choppy price action such as was seen in the first half of the year is the special on the menu.
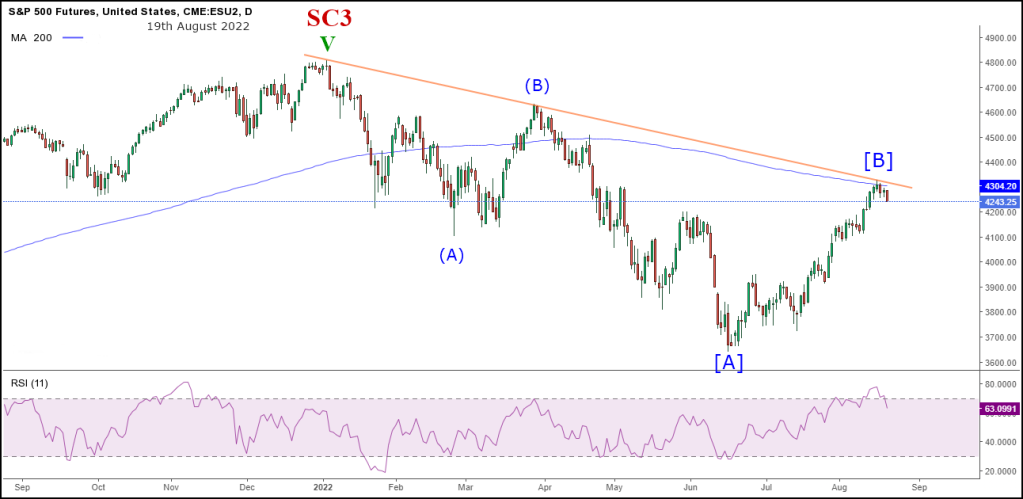
19th August 2022
On this Friday it is OpEx, see the link below. The chart shows that three descending peaks align, and the daily RSI has peaked in overbought and the 200 MA was bumped earlier this week. Its a lot to ignore but ignorance is temporary bliss.
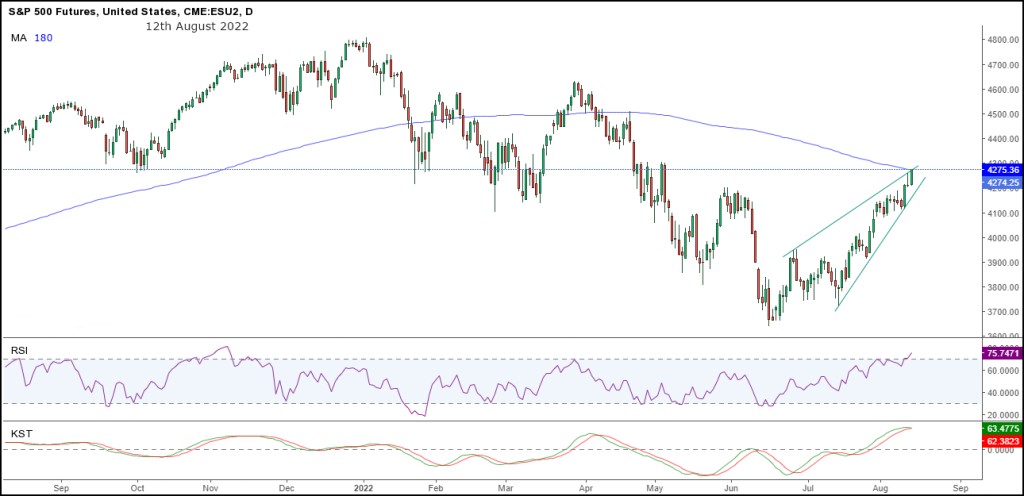
12th August 2022
The exuberance of the rally is indicated to be pushing its luck. A myopic misinterpretation of data within the current overall environment along with FOMO is the cause, but the market has become used to a little coordinated help from above over the years and exuberates on regardless.
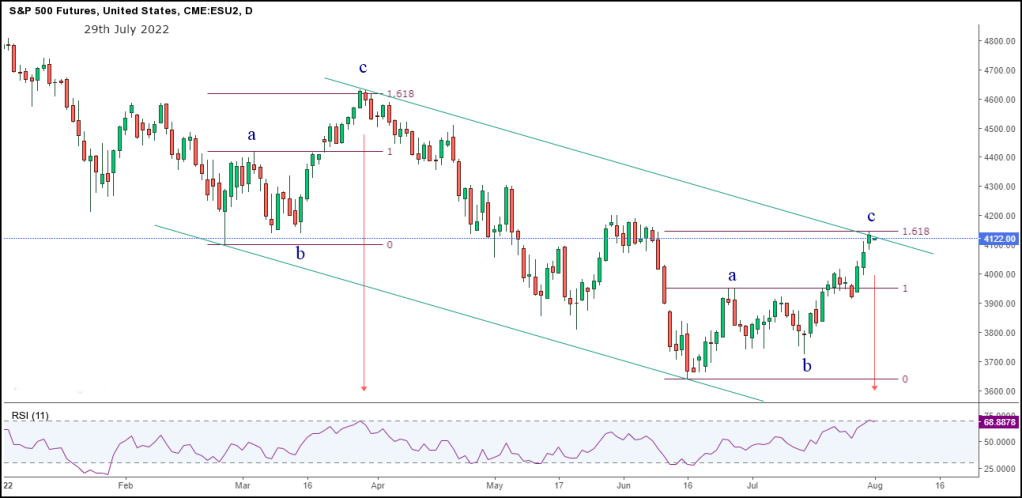
29th July 2022
The daily chart for S&P 500 futures gives substantial indication for a resumption of the bear trend.
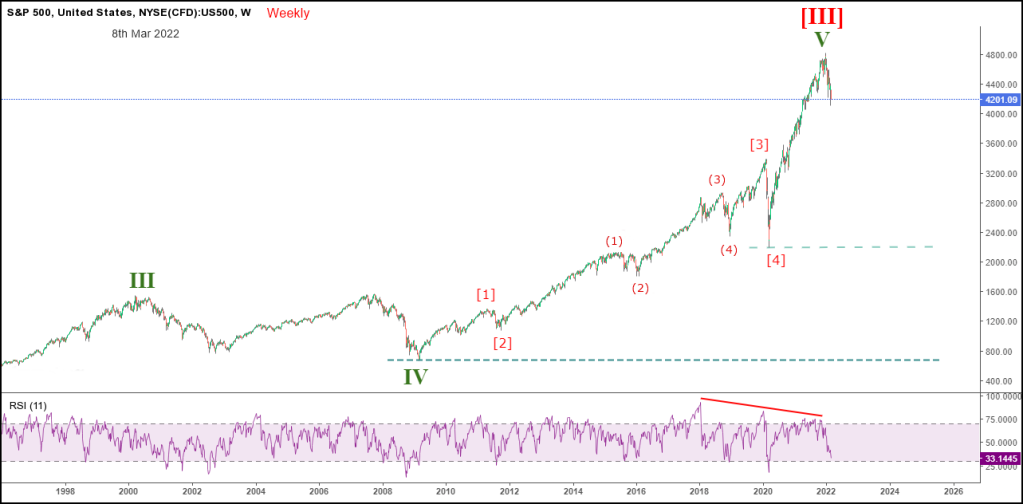
8th Mar 2022
This weekly chart of the S&P 500 index takes the view that the 3rd Supercycle of the Grand Supercycle has been concluded. This view sees the commence of this Supercycle followed the 1929 crash and produced a very extended 3rd Cycle. The most popular target for this correction becomes IV with a timeframe similar to that of wave V.
5th January 2022
ETF – S&P500 IT – JSE
Yet another chart that sees a Cycle degree turning point. The typical target is [4].


Home page provides Covid insights and list of charts.
